Powered by Health Story
Track your blood pressure and pulse with Health Story's Blood Pressure module. Log systolic and diastolic readings alongside your pulse, monitor trends through charts and history, and get a clear summary of where your readings fall — with PDF reports ready to share with your doctor.
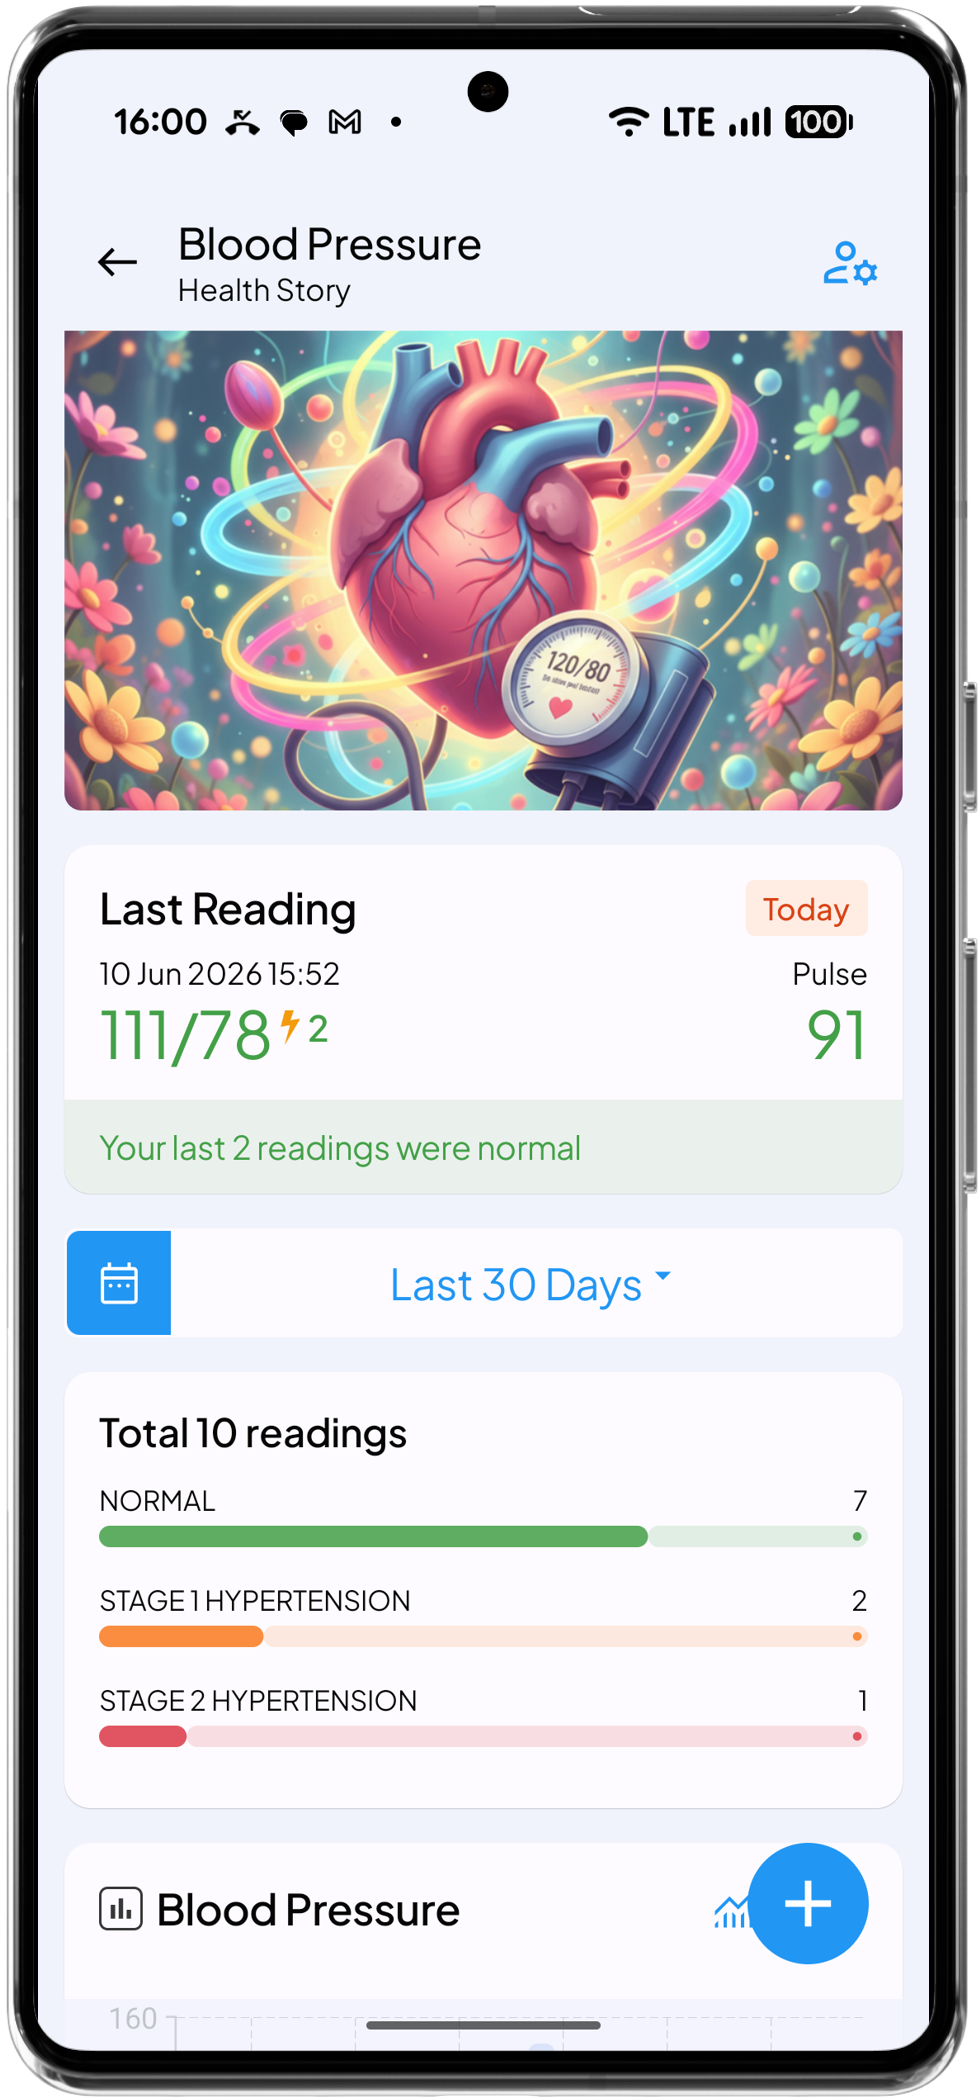
Record your systolic and diastolic blood pressure along with your pulse after every reading. Each entry is timestamped so your log reflects exactly when readings were taken. Consistent logging is the foundation of understanding your blood pressure over time.
Health Story automatically categorises each reading as low, normal, elevated, or high based on standard blood pressure ranges. Your summary shows a count of readings in each category so you can see your overall pattern clearly — not just individual numbers, but how often your blood pressure is where it should be.
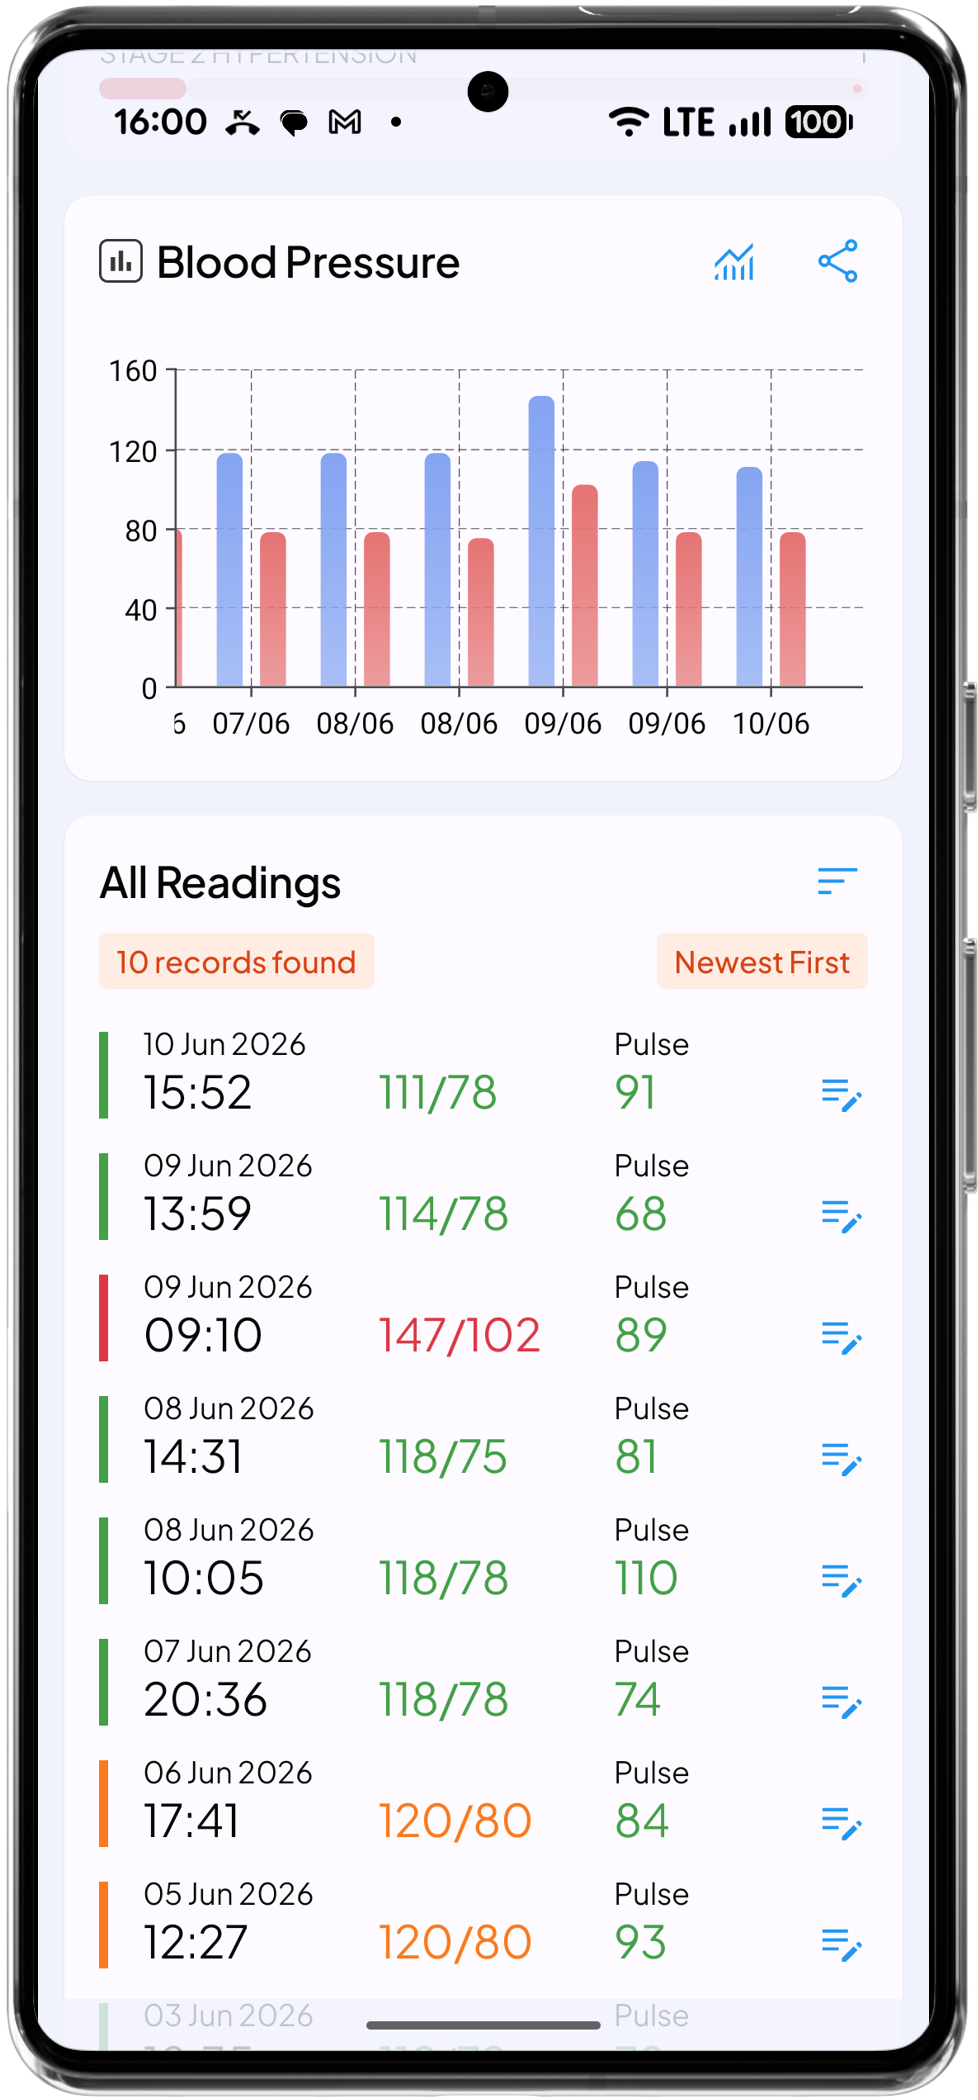
View your systolic and diastolic trends through clean, easy-to-read charts. Track how your blood pressure changes across days, weeks, and months, spot patterns tied to time of day or lifestyle changes, and see at a glance whether your readings are improving, stable, or drifting in the wrong direction.
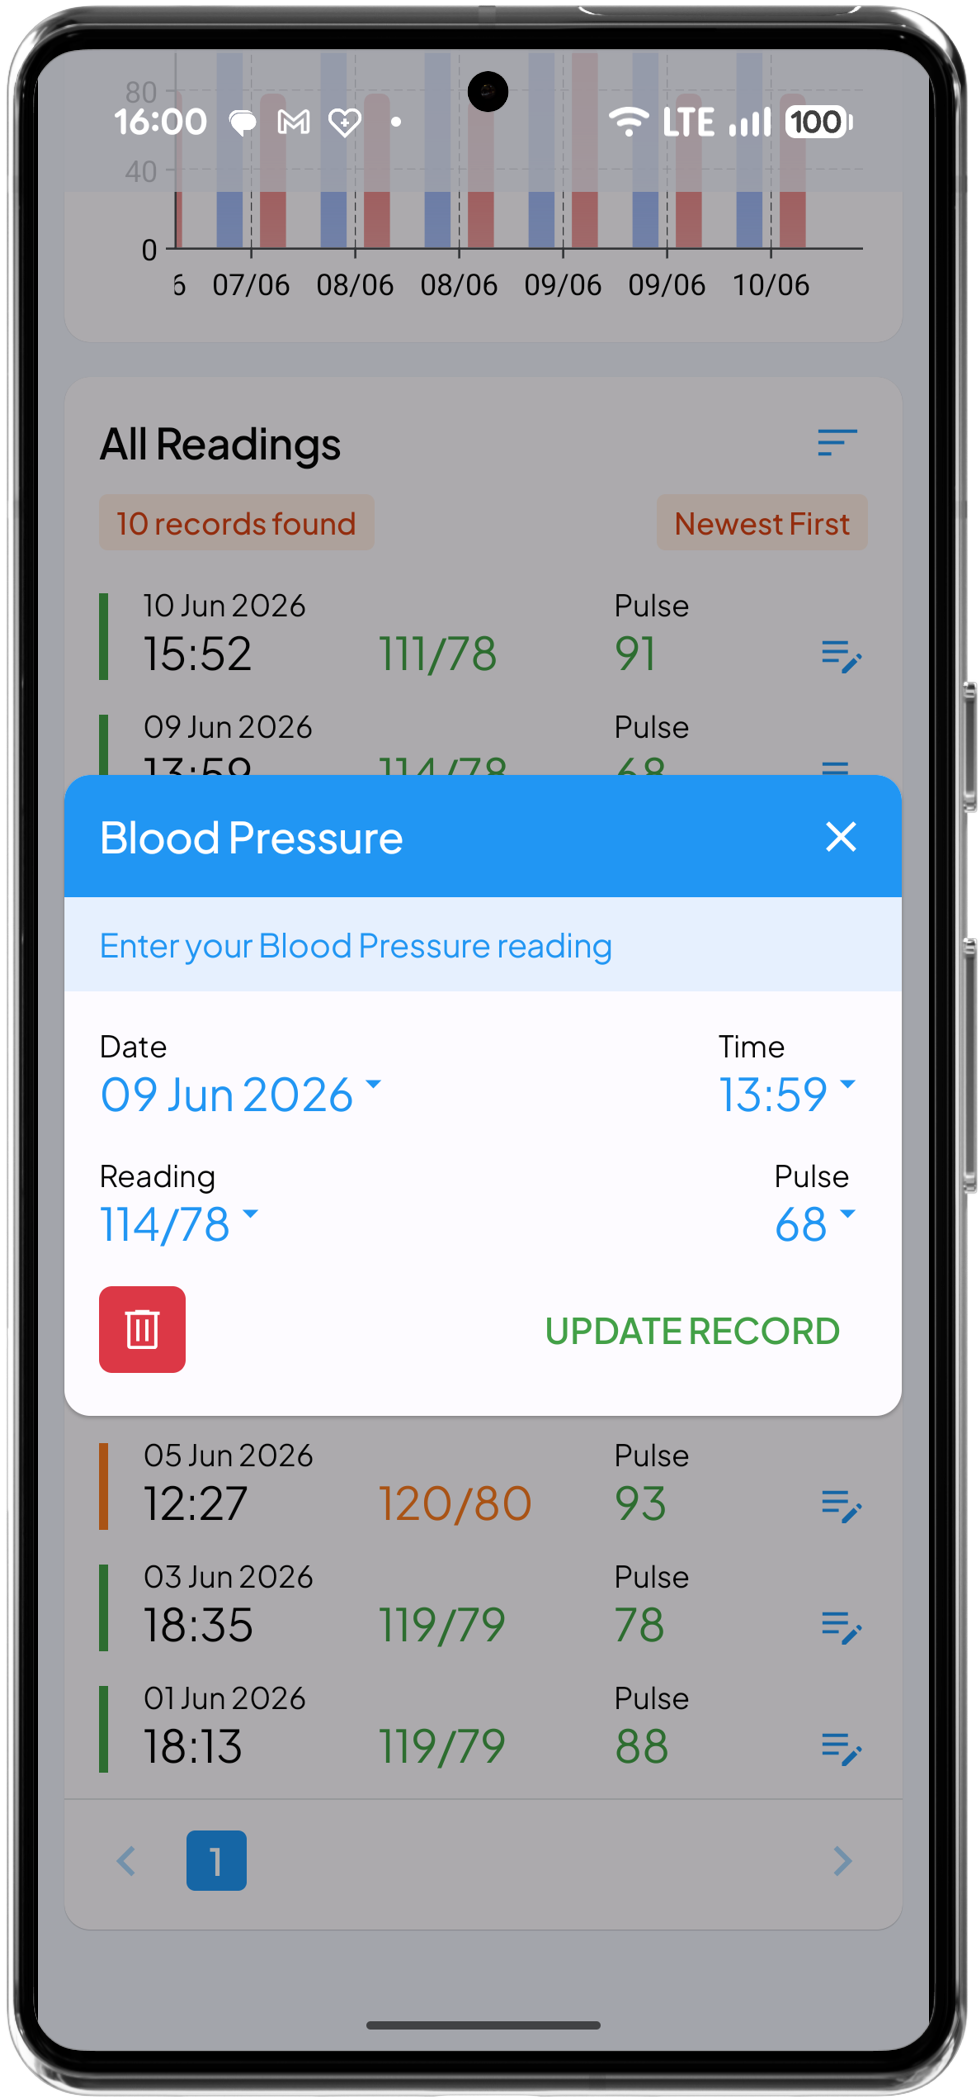
Browse your complete blood pressure history in a sortable, color coded list, so high and low readings stand out immediately. Edit or delete any entry at any time to keep your records accurate. A clean, organised log makes it easy to review your history before a doctor's appointment or whenever you need a quick reference.
Generate a comprehensive PDF report of your blood pressure history at any time. Share it with your doctor, cardiologist, or specialist without transcribing numbers by hand. The report includes your readings, pulse, trends, and category summary in a clean format that's ready to use in any medical consultation.