Health Story Blood Sugar Log

Blood Sugar Log

Powered by Health Story

Track your blood sugar levels throughout the day with Health Story's Blood Sugar module. Log readings before and after meals, at bedtime, and at custom times, monitor trends with detailed charts and statistics, and understand your glucose patterns with insights and comprehensive PDF reports.
Screenshots

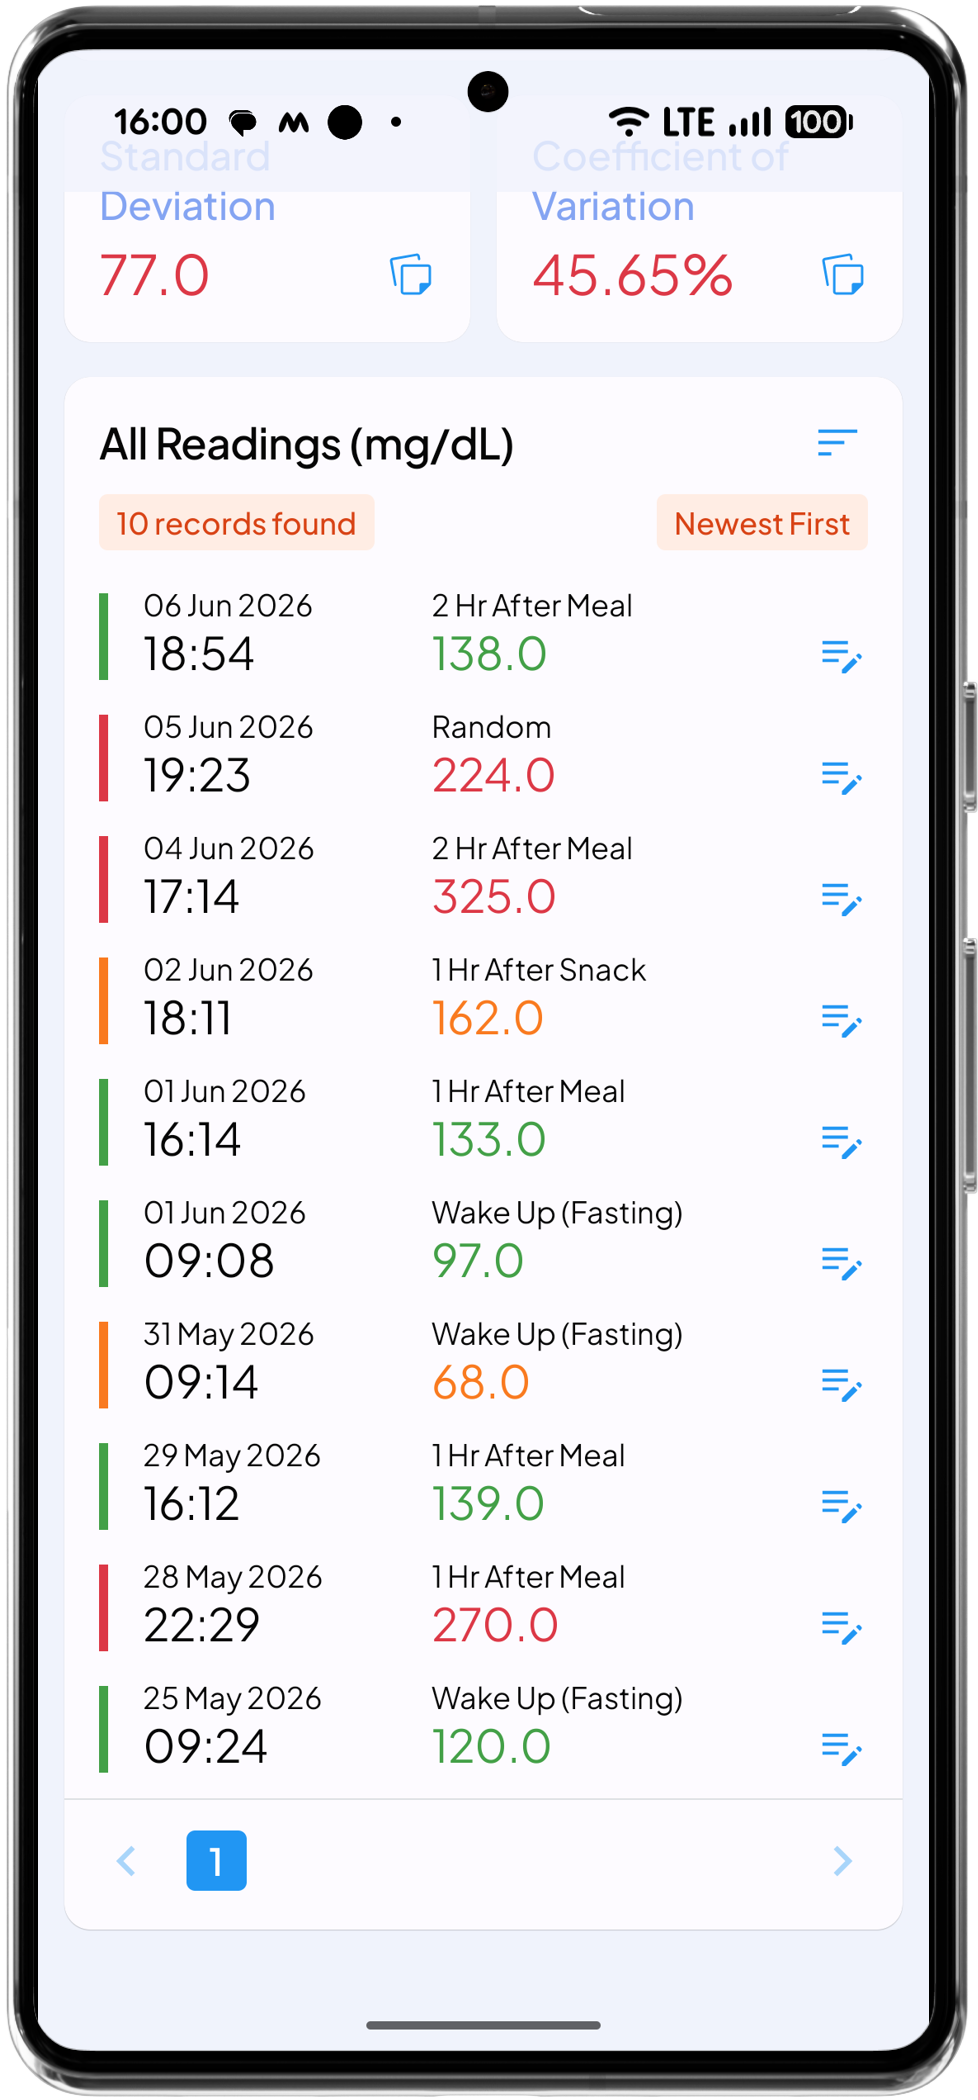
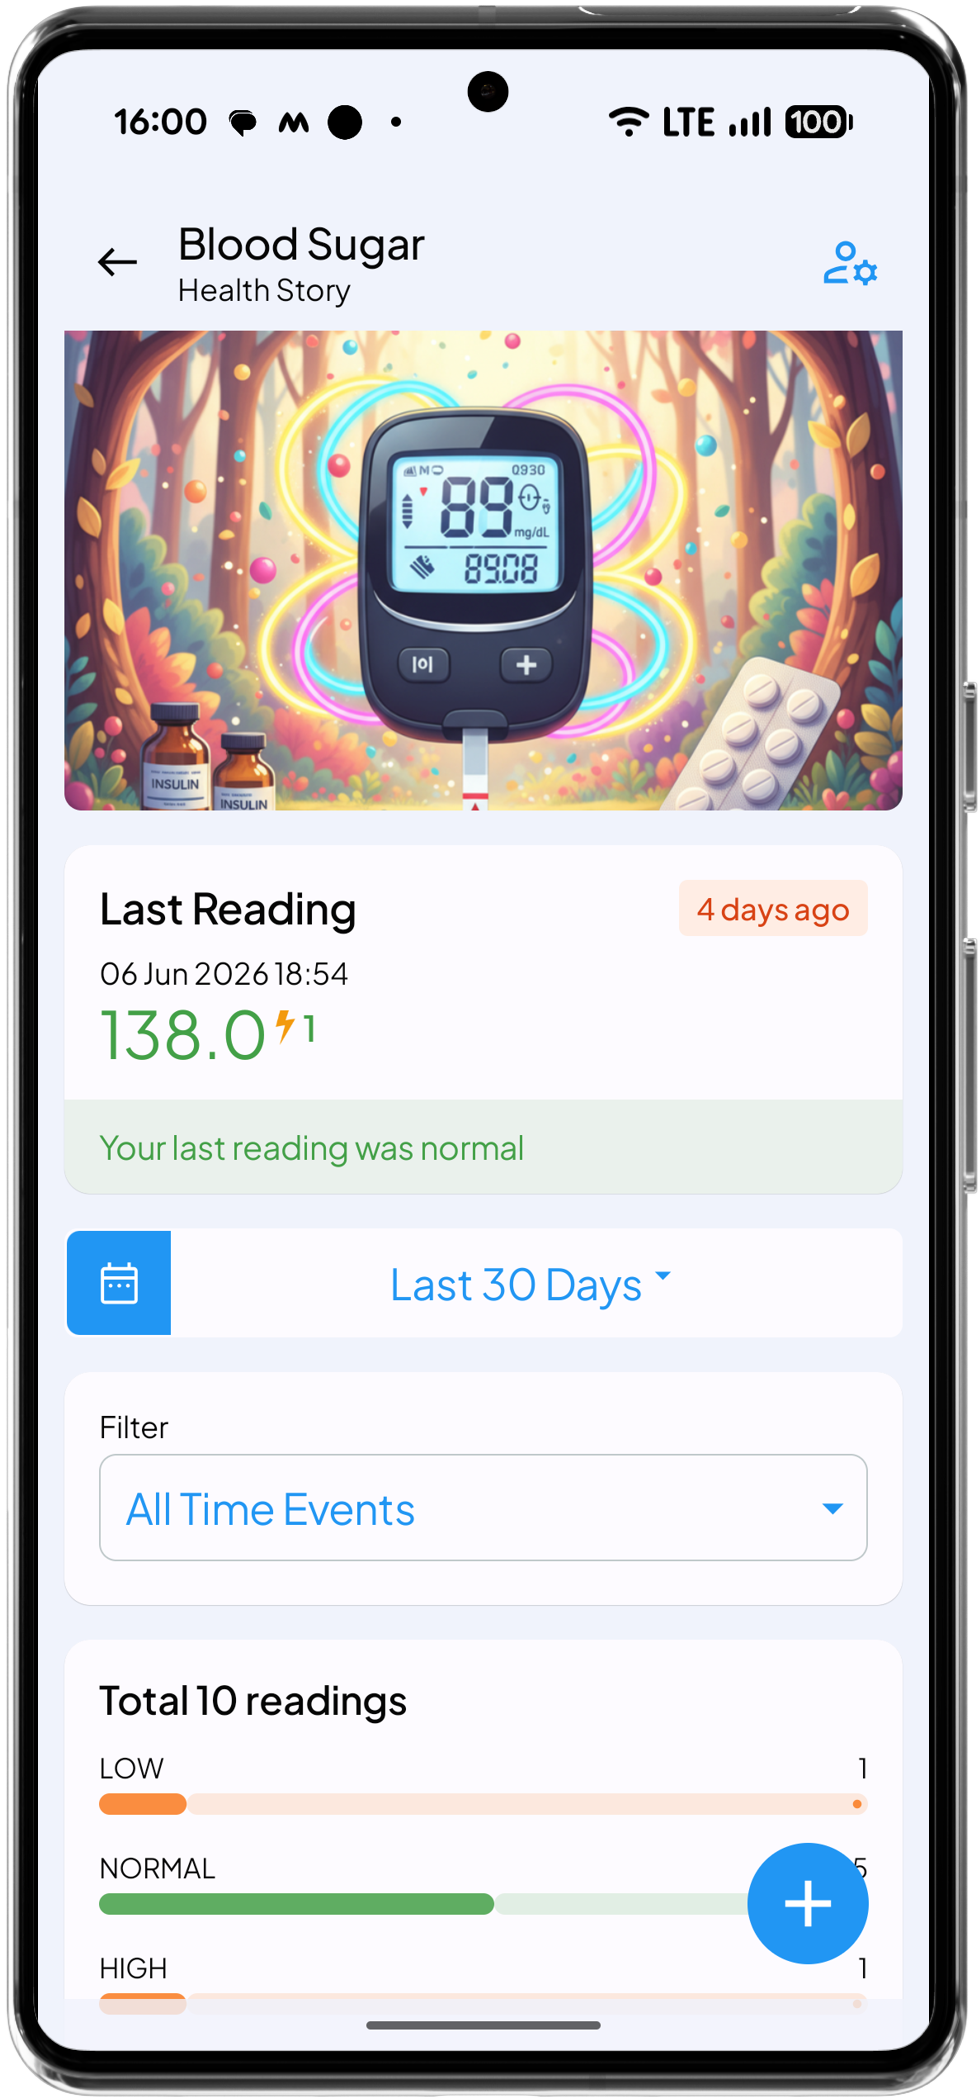
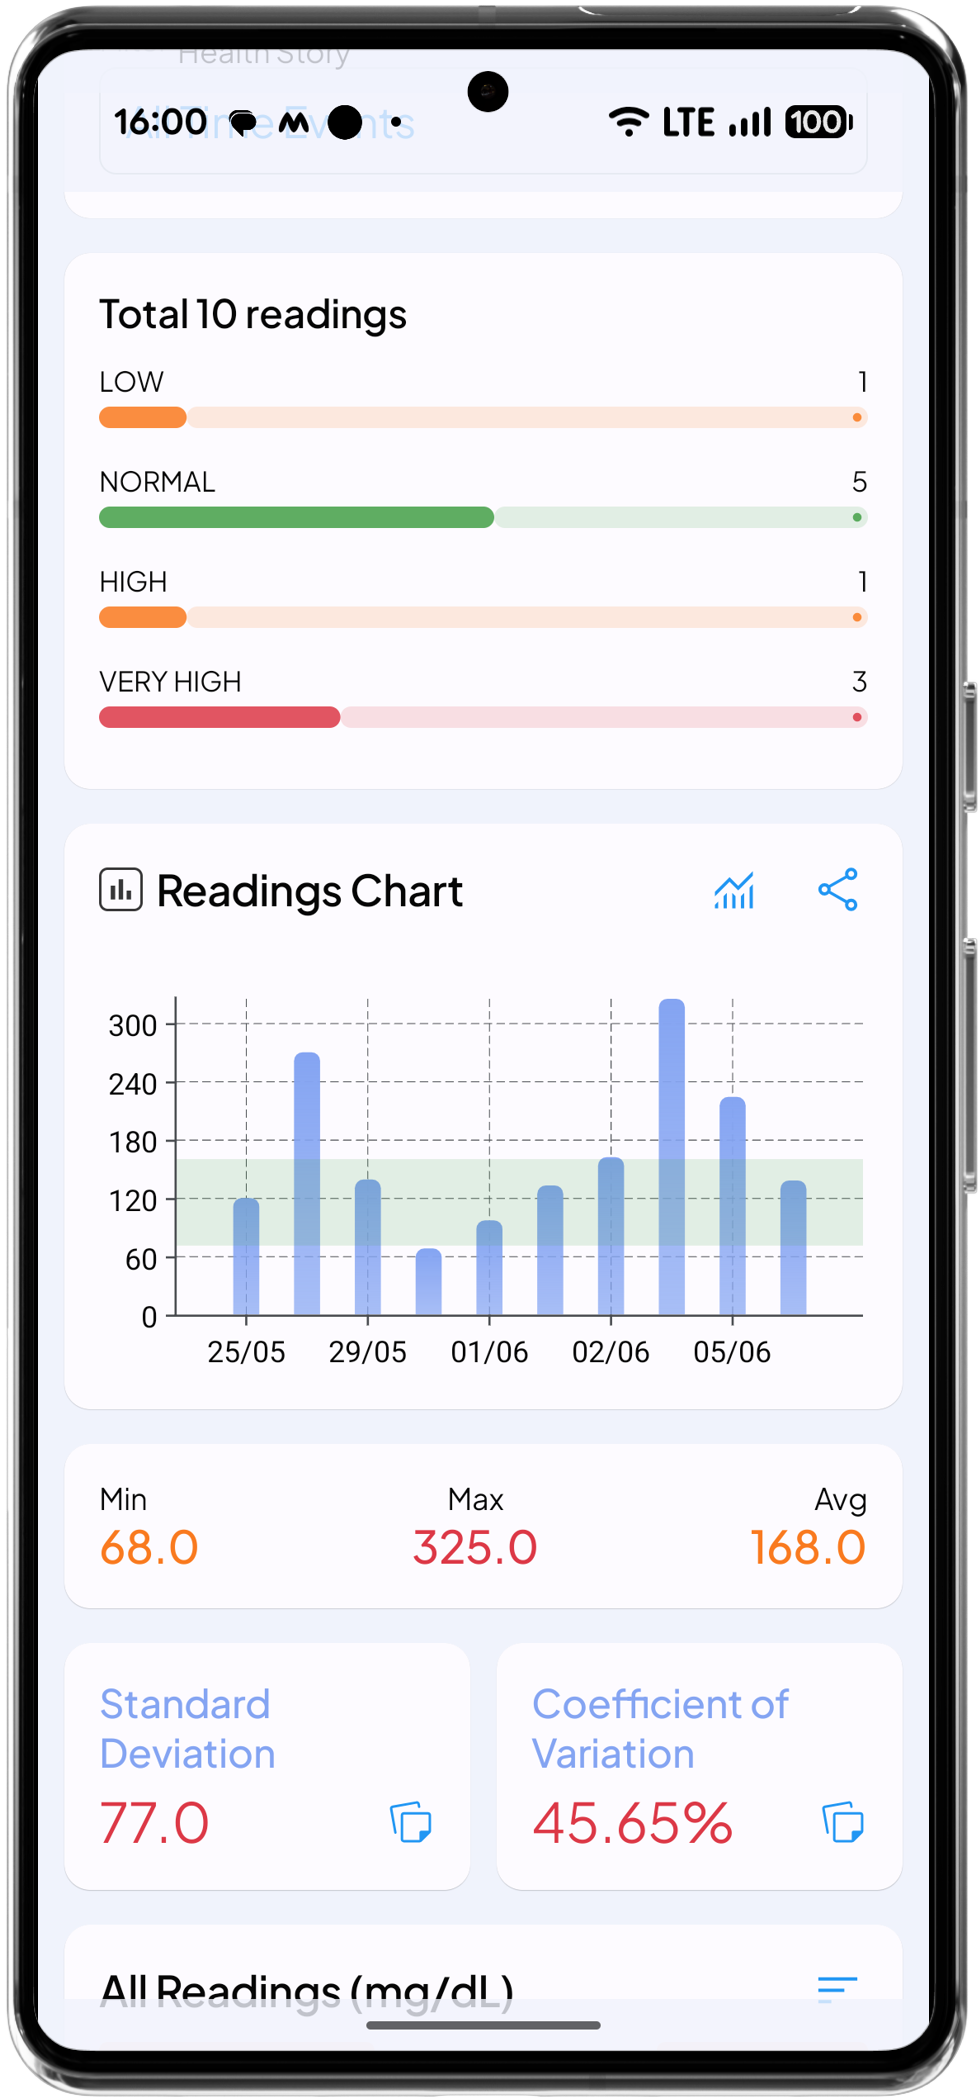
Health Story Blood Sugar Log showing last blood sugar reading and last 30 days summary Health Story Blood Sugar Log showing a chart with minimum, maximum, average glucose levels as well as standard deviation and coefficient of variation Health Story Blood Sugar Log showing list of readings with color coding, time stapms and edit option
Download on Google Play

Log Readings Anytime

Record your blood sugar at any point in the day — fasting, before a meal, 2 hours after eating, at bedtime, or any custom time that fits your routine. Each reading is timestamped and tagged by occasion so your log stays organized and meaningful rather than just a list of numbers.

Supports mg/dL and mmol/L

Whether your doctor, glucometer, or country uses mg/dL or mmol/L, Health Story works in both. Switch between units at any time and all your readings, charts, and reports update instantly. No manual conversions, no confusion — just your data in the format you're used to.

Your Own Normal Range

Everyone's ideal blood sugar range is slightly different. Health Story lets you set your own normal range rather than enforcing a one-size-fits-all threshold. Readings are shown in context of your personal range, so you can see at a glance what's within target and what isn't — on your terms, not a generic default.

Charts & Trends

See your glucose patterns clearly through daily, weekly, and monthly charts. Track how your readings change across different times of day, spot recurring highs or lows, and understand how your levels shift over time. Visual trends make it easier to have informed conversations with your doctor and take meaningful action.

Standard Deviation & Variability

Health Story goes beyond averages. See your standard deviation and coefficient of variation alongside your mean glucose — the same metrics used clinically to assess glucose stability. Low variability means consistent control. High variability is a signal worth paying attention to, even when your average looks normal.

PDF Report Generation

Generate a clean, comprehensive PDF report of your blood sugar history at any time. Share it with your doctor, endocrinologist, or diabetes educator without manually copying numbers. The report includes your readings, trends, and statistics in a format that's easy to read and ready to use in a medical consultation.